Transcriptomics
This page was produced as an assignment for Genetics 564 an undergraduate capstone course at UW-Madison.
What is the difference between a genome and a transcriptome?
The genome is the complete set of genetic information for an organism, including the genes, mitochondria, and non-protein coding DNA [1]. In contrast, a transcriptome is the total RNA product, transcribed from various regions of the genomic DNA [2]. Transcriptomes can reveal genomic expression levels, because the presence of a transcript is a result of a gene in the genome being expressed and transcribed, caused by various events, some of which include a response to a cellular signal initiating transcription or the result of an overactive transcription factor. The transcriptome includes much more than just coding mRNAs that eventually become proteins. Various types of non-coding RNA exists and comprise the transcriptome, shown in Figure 1.
Figure 1. The results of transcription. This diagram shows some of the RNA products that are included in the transcriptome.
What is transcriptomics? What is RNA Sequencing?
Transcriptomics is the study of the transcriptome. One major tool used in transcriptomics to catalog and map the transcriptome is RNA-Sequencing. RNA-Seq relies on converting RNA into cDNA fragments and using high-throughput sequencing to generate single or paired-end sequences that are between 30-400 base pairs long [3]. If a reference genome or transcript is available, this output can be aligned to it to create a transcription map. Otherwise, the output can be assembled de novo, or without reference. Regardless of which type of alignment is used, the result is a transcription map that shows the structure and overall expression level for each gene [3].
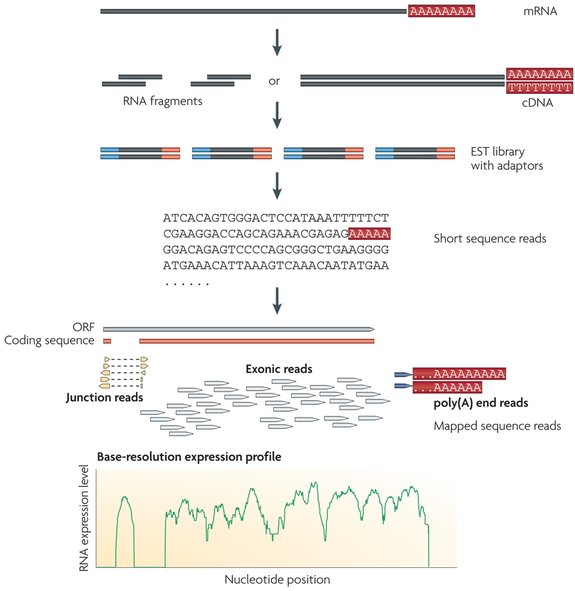
Figure 2. Overview of the RNA-Seq process. From: Wang, Z., Gerstein, M., & Snyder, M. (2009). RNA-Seq: a revolutionary tool for transcriptomics. Nat Rev Genet, 10(1): 57-63
Transcriptomics and ERCC6
When studying a disease, identifying which genes are expressed in an affected individual is paramount to understand the disease phenotype, both on a macro and molecular level. Understanding how a disease up or down regulates expression of known proteins helps shed light on how many processes the disease is altering, and to what extent. For ERCC6 and Cockayne Syndrome, knowing which processes experience differential regulation when ERCC6 is knocked out or down may shed light on the complex and extremely diverse phenotypes that CS patients often show. To explore genes that were deferentially expressed along with ERCC6, GEO profiles and GEO datasets were used.
Geo profiles act as a database of measured transcription levels from a variety of conducted experiments. The transcription levels are measured under a variety of different experimental conditions. Unfortunately, the only information on ERCC6 and Cockayne Syndrome found in the GEO profiles was data from an experiment where CSB was rescued in CSB-deficient fibroblasts by using CSB cDNA. The expression levels from this experiment are displayed in Figure 3.
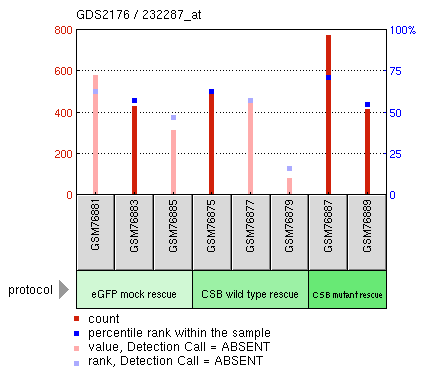
Figure 3. CSB protein fibroblast rescue. CSB-null protein fibroblasts are rescued by CSB cDNA expression.
Geo datasets contain heat maps, and are associated with Geo profiles. For example, I was able to find a large cluster heat map associated with the experiment that produced Figure 3. These heat maps show differential expression of a variety of genes. In the heat map shown in Figures 4 and 5, pink represents higher levels of expression relative to the normal, while green represents lower levels of expression.
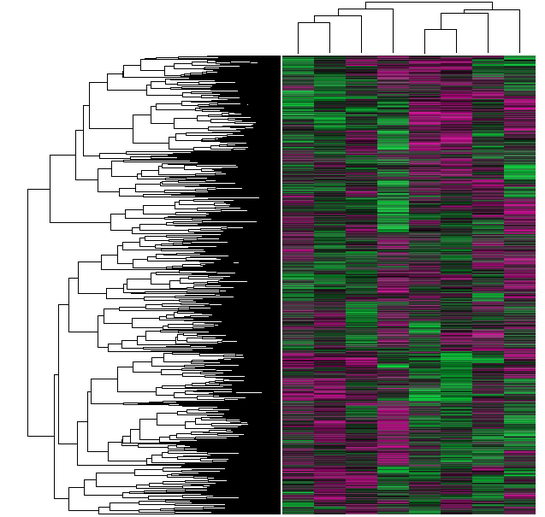
Figure 4. A large heat map showing expression levels associated with CSB rescue by CSB cDNA. In the heat map, each column represents a different sample, while each row is an affected gene.
|
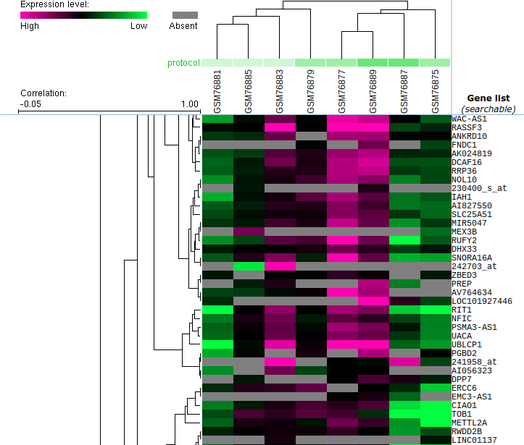
Figure 5. Zoomed in on Figure 4, showing some genes and their differential expression levels.
|
Conclusions
Unfortunately, the GEO Profile and GEO Dataset exploration yielded results that are not directly important to the question I am asking about Cockayne Syndrome. Analyzing the gene expression levels of genes that are involved in managing oxidative stress when ERCC6 is knocked out would help reveal if ERCC6 plays a direct role in the oxidative stress repair pathway. I hypothesize that knocking out ERCC6 would cause other genes in the oxidative stress repair pathway to be over expressed, in order to compensate for the loss of ERCC6.
References
[1] https://ghr.nlm.nih.gov/primer/hgp/genome
[2] https://www.genome.gov/13014330/
[3] Wang, Z., Gerstein, M., & Snyder, M. (2009). RNA-Seq: a revolutionary tool for transcriptomics. Nat Rev Genet, 10(1): 57-63. https://www.ncbi.nlm.nih.gov/pmc/articles/PMC2949280/
Images and Videos
Background image: https://vimeo.com/129926451
Figure 1: http://csls-text.c.u-tokyo.ac.jp/active/03_02.html
Figure 2: Wang, Z., Gerstein, M., & Snyder, M. (2009). RNA-Seq: a revolutionary tool for transcriptomics. Nat Rev Genet, 10(1): 57-63. https://www.ncbi.nlm.nih.gov/pmc/articles/PMC2949280/
This website was created for Genetics 564 by Zachary Beethem, an undergraduate genetics major at UW-Madison.
He can be reached via email: [email protected]
Date of last website update: April 2017
